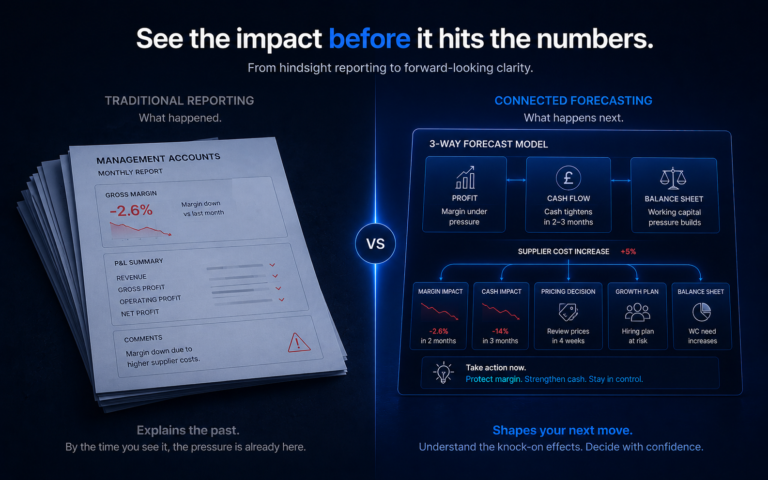
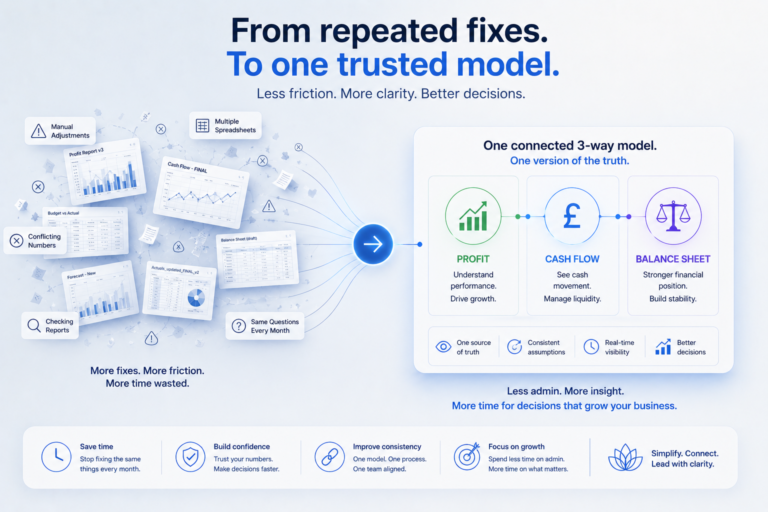
Dark blue presentation slide titled “One forecast. Too much certainty.” It explains that the future is uncertain and scenario planning helps prepare for different outcomes. On the left, a “Single Forecast” chart shows one upward performance path, warning that a single path does not show what could change. On the right, a “Scenario Planning” chart shows three possible outcomes over time: best case rising strongly, most likely rising moderately, and worst case declining. A bottom row highlights four benefits: plan for change, test assumptions, prepare for pressure, and stay in control.

Scenario Planning for SMEs: What You Should Actually Be Modelling

Scenario planning is not about predicting a single variable. It is about understanding how your business responds to change. For most SMEs, the relevant drivers are not isolated factors like interest rates. They are the practical variables that affect revenue, costs, and cash in day-to-day operations. The objective is not precision. It is understanding how…

Infographic explaining a connected 3-way financial model that links profit and loss, cash flow, and balance sheet insights. It shows how modelling profit, cash, and position together improves visibility, clarifies timing, supports better decisions, and helps build a stronger business for future growth.

The Future of SME Finance: Why Financial Software Alone Is No Longer Enough

Software has improved financial reporting significantly. But many growing SMEs still struggle with: The issue is rarely a lack of software. It is that software alone cannot create financial clarity without the right structure, interpretation, and expertise behind it. The future of SME finance is not human expertise versus technology. It is expert-led financial systems…

Infographic showing a polished financial dashboard above a cracked, unstable data foundation. The top layer represents visible dashboards, KPIs, trends, and clarity, while the lower layer reveals disconnected data, broken links, inconsistent timing, unreliable outcomes, and weak forecasts hidden underneath.

When Financial Dashboards Look Smart but the Numbers Still Don’t Work

One of the risks with modern financial reporting is that unclear financial information can still look highly convincing. Dashboards improve presentation. But presentation is not the same as financial clarity. A business can have: while still struggling to explain: The issue is usually not the dashboard itself. It is that the underlying financial information is…

Infographic comparing a bulky 40+ page monthly report pack with a streamlined 3-page monthly insight pack. The image shows the old reporting process as heavy, slow, noisy, unclear, and reactive, while the new insight pack is positioned as light, fast, decision-ready, focused, proactive, and actionable for better business decisions.

Financial Drag: How to Audit Your Reporting for Maximum SME Agility

A finance audit for reporting drag is a systematic process of identifying and removing redundant data, overly complex structures, and reactive processes within a company’s financial function. By stripping the accounting engine down to its essential drivers and implementing a 3-way integrated system, an SME can move from “post-mortem” reporting to a state of constant,…

Dark blue timeline graphic titled “Timing matters more than the dividend.” A dividend decision made today is shown leading through future monthly obligations and priorities, including VAT payment, payroll, investment, growth plans, and a financial buffer. The image emphasizes that visibility today creates stability tomorrow by helping leaders understand the full impact before deciding.

Dividend Anxiety: How to Reward Shareholders Without Creating Cash Flow Pressure

A dividend should be a reward for building a successful business. Yet many business owners hesitate before taking one. Not because the business is unprofitable, but because they are unsure what happens next. The question is rarely: Can we pay a dividend? The more important question is: What happens to cash after we pay a…

Dark blue financial dashboard graphic with the headline “Trust comes from connection. Not from more reports.” Three glowing connected panels show Profit, Cash Flow, and Balance Sheet metrics flowing into one another, with supporting messages about trusted performance, confident decisions, and stronger relationships. A footer states: “Connected financials build confidence. One model. All connected. Always trusted.”

Would Your Financial Information Stand Up To Scrutiny?

Most businesses feel comfortable with their financial information until somebody important starts relying on it. Suddenly, the question is no longer: “Do we have the numbers?” It becomes: “Can we defend the decisions those numbers support?” That is often where businesses discover the difference between producing financial information and truly understanding it. Key Takeaways Why…

Dark blue blog graphic showing a clean financial forecasting model with Profit & Loss, Cash Flow, and Balance Sheet cards connected along a glowing line. A rising bar chart and arrow lead to a “2.8x” exit multiple, reinforcing the message: “Clean Forecasting. Stronger Valuation

How Clean Finance Forecasting Increases Your Final Exit Multiple

Valuation is driven by how well a buyer can rely on your financial model. A forecast that: can be tested. If a forecast cannot be tested, it cannot be relied on. And if it cannot be relied on, it reduces confidence in the outcome. Key Takeaways Why Valuation Is Driven By Confidence, Not Just Performance…

Dark, futuristic graphic showing many scattered expense categories on the left being streamlined through glowing blue lines into three clear financial groups on the right: Revenue, Costs, and Cash. The headline reads, “Simplify the structure. Add lightness to your decisions.” Supporting text highlights “Less noise,” “More clarity,” and “Better decisions.”

Why Your Financial Data Doesn’t Support Decisions (And How to Fix the Structure)

If your financial data does not support decisions, the issue is rarely the report itself. It is the structure behind it. When financial data is not organised in a way that reflects how the business operates, it becomes difficult to: The objective is not better reporting. It is a structure that produces usable information. Key…

A dark blue roadmap graphic titled “90 Days to a Stronger Finance Function,” with the subtitle “Rebuild reliability. Restore visibility. Drive better decisions.” It shows three phases across a horizontal timeline: Days 1–30 Diagnose, focused on identifying disconnects and visibility gaps; Days 31–60 Rebuild, focused on simplifying and aligning reporting and forecasting; and Days 61–90 Restore, showing finance dashboards for revenue, cash position, working capital, and a 3-way forecast. A footer highlights outcomes including consistent information, reliable forecasting, clear visibility, stronger decisions, and sustainable growth.

What the First 90 Days of Fixing Your Finance Function Look Like

Most finance functions do not break all at once. Problems usually build gradually through: Over time, businesses often compensate manually. Eventually, the finance function continues operating mainly through intervention rather than structure. The first 90 days of fixing a finance function are therefore rarely about introducing more reporting. They are usually about rebuilding reliability underneath…

A dark blue finance-themed growth graphic showing an upward curved line with milestones: Understand, Plan, Monitor, and Decide. Below the line are three dashboard cards for Profit & Loss, Cash Flow, and Balance Sheet, each showing positive financial metrics and small trend charts. The headline reads “Growth with clarity. Backed by connected finances,” emphasizing connected forecasting, real-time visibility, aligned teams, and confident growth.

Why Growing Too Fast Is the #1 Killer of Profitable UK Businesses (and How to Spot the Signs)

Growth is usually viewed as a positive signal in business. But for many SMEs, rapid growth creates financial pressure long before operational problems become obvious. This is because growth changes: all at the same time. A business can become commercially stronger while at the same time becoming financially weaker. The issue is rarely growth itself….