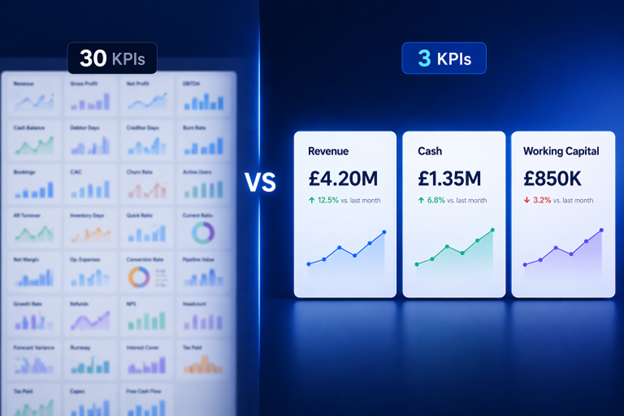
The Minimalist Dashboard: Why 3 KPIs You Actually Use Beat 30 You Don’t Understand
A dashboard is only useful if it leads to decisions.
Most businesses track too many metrics, creating noise instead of clarity. A small number of well-chosen KPIs, understood and acted upon, will always outperform a large set of poorly used ones.
In practice, this usually comes down to three connected measures:
- performance (Profit & Loss)
- cash (Cash Flow)
- timing and position (Balance Sheet)
The objective is not to measure everything.
It is to focus on what actually drives decisions.
Key Takeaways
- More KPIs do not improve decision-making
- KPIs must link to Profit & Loss, Cash Flow, and Balance Sheet
- A small number of metrics improves clarity and speed
- 3-way thinking creates better insight than isolated KPIs
- Most dashboards fail due to overload
- Simplicity improves control
Why Do Most Dashboards Become Unusable Over Time?
Most dashboards grow without structure.
- New KPIs are added
- Nothing is removed
- Reporting expands without purpose
The result:
- Too many numbers
- No clear priority
- Slower decisions
The issue is not data. It is a lack of discipline.
Does Tracking More KPIs Actually Improve Performance?
In most cases, no.
More metrics create:
- Fragmented attention
- Competing signals
- Reduced engagement
When everything is measured: nothing stands out.

What Should A KPI Actually Do?
A KPI should:
- Highlight a specific issue
- Indicate whether action is required
- Support a decision
If a KPI:
- Does not lead to action
- Is not clearly understood
It should not be there.
If everything matters, nothing drives action.
Which 3 KPIs Actually Matter In Practice?
A useful dashboard should accurately reflect the business’s financial performance.
Research by McKinsey suggests that for effective performance management, businesses should limit themselves to between three and eight key metrics to avoid redundancy.
In most SMEs, three KPIs are sufficient when they follow a 3-way structure:
1. Revenue or Gross Profit (Profit & Loss)
This shows what the business is generating.
It answers:
- Are we growing?
- Is the core activity performing?
This is the starting point of the model.
2. Net Cash Movement or Cash Position (Cash Flow)
This shows what is actually happening.
It answers:
- Is cash increasing or decreasing?
- How long can we operate?
This reflects reality, not just reported performance.
3. Working Capital Movement (Balance Sheet + Cash Flow)
This explains the difference between profit and cash.
It answers:
- Why is cash different from profit?
- What is affecting timing?
For example:
- Debtors increasing → cash delayed
- Creditors changing → cash timing shifts
This is where most issues sit.
Together, these three KPIs reflect:
- Profit & Loss → performance
- Cash Flow → reality
- Balance Sheet → position and timing
This is effectively a simplified 3-way view.
Why Do These KPIs Need To Be Connected?
The key principle is not just the KPIs themselves, it is how they link.
For example:
- revenue (P&L) → creates debtors (Balance Sheet)
- debtors → convert into cash (Cash Flow)
If KPIs are viewed in isolation, insight is lost
If they are connected, decisions become clearer
How Does This Relate To 3-Way Forecasting?
3-way forecasting applies the same principle forward-looking.
Each forecast entry:
- affects Profit & Loss
- impacts Cash Flow
- creates a Balance Sheet movement
A dashboard should reflect the same logic:
- not just what happened
- but how it flows through the model over time
When built properly, this reflects how the business behaves, not just what the numbers show.
This is where most KPI dashboards fall short.
They show outputs, not relationships.
What Happens When Dashboards Include Too Many KPIs?
Typical issues:
- important signals get diluted
- teams stop engaging with the data
- decision-making slows down
Many KPIs become:
- “nice to know”
- rarely used
- not decision-driven
If removing a KPI changes nothing, it is not required.
Are Generic KPI Templates Useful?
Usually not.
KPIs should reflect how the business operates.
For example:
SaaS:
- revenue → recurring revenue
- cash → runway
- working capital → deferred revenue
Services:
- revenue → billings
- cash → inflows vs payroll
- working capital → debtor days
The structure stays consistent. The drivers change.
How Should A Dashboard Be Structured For Decision-Making?
A dashboard should:
- highlight key movements
- show connections between KPIs
- be understood quickly
It should not:
- require detailed analysis
- contain unnecessary detail
- duplicate information
It should support fast, informed decisions.
Why Do Most KPI Dashboards Fail To Drive Action?
Common reasons:
- KPIs are not linked to decisions
- The financial impact is unclear
- Too many metrics are tracked
This results in:
- Reporting without action
- Data without clarity
A KPI that does not drive action is not useful.
How Do You Reduce KPIs Without Losing Insight?
This requires a structured removal.
Each KPI should be tested:
- Does it drive a decision?
- Does it link to financial outcomes?
- Is it clearly understood?
If not: remove it
Insight improves as noise reduces.
What Does A Minimal, Usable Dashboard Look Like?
A strong dashboard:
- Focuses on a small number of KPIs
- Reflects financial reality
- Highlights changes quickly
It allows:
- Fast understanding
- Clear decisions
- Consistent use
It should take minutes to review, not hours.
Minimalist Vs Overloaded Dashboards
| Area | Overloaded Dashboard | Minimalist Dashboard |
| Number of KPIs | High | Limited |
| Clarity | Low | High |
| Decision speed | Slow | Fast |
| Engagement | Low | High |
| Actionability | Limited | Strong |
What Does This Mean In Practice For SMEs?
A dashboard should:
- Reflect performance (P&L)
- Explain cash (Cash Flow)
- Highlight timing (Balance Sheet)
It should not:
- Attempt to measure everything
- Include unused metrics
- Create complexity
The objective is clarity, not completeness.
Are You Using Your KPIs or Just Reporting Them?
Most businesses do not lack data.
They lack focus.
A small number of clearly defined, connected KPIs will always outperform a large set of unused metrics.
Better decisions come from understanding fewer things properly.
If your dashboard is not helping you make decisions, it may need to be simplified. FDPack helps businesses build structured, 3-way aligned dashboards that connect performance, cash, and decision-making.
FAQs
1. Why are three KPIs often enough?
They reflect performance, cash, and timing. Together, they provide a complete financial view.
2. What is the link between KPIs and 3-way forecasting?
Both connect Profit & Loss, Cash Flow, and Balance Sheet. This ensures decisions are based on complete information.
3. Should all KPIs link to financial statements?
Yes. KPIs should reflect real financial outcomes. Otherwise, they do not support decisions effectively.
4. What is the biggest KPI mistake?
Tracking metrics that do not drive action. This creates noise without improving performance.
5. How often should KPIs be reviewed?
Regularly, but with focus on action. Review should lead to decisions, not just reporting
