The FDPack Methodology
Our unique service is centred around keeping things as simple as possible and doing the basics well, using our proprietary FDPack software which has evolved over more than 15 years’ experience of working with the finances of a wide variety of businesses.

How we bring your financial statements to life
Experience has taught us that the financials of any small or medium sized business can be understood and managed with just the three traditional financial statements, providing that they are well structured, clearly presented and kept up to date.
They combine to provide the visibility a business needs for effective decision making:

Profit & Loss
Sales, expenses, margins & profit / loss.

Cashflow
Bank balance movement analysed by trading and non-trading cash inflows and outflows.

Balance Sheet
What the business owns and what it owes; assets and liabilities, short and long term.
Here are your future numbers. If they are not what you want, then you need to act now.
Spencer Smith, FDPack
The FDPack 10 step process
Our core deliverables are accurate and up to date monthly financial statements for actual, budget, forecast and strategic plan, in both summary and detailed format, with unlimited options for timeline or comparative analysis and drill downs to see transaction level detail.
We have a trusted and well-defined 10 step process, so that our clients know exactly what to expect before we start.

- An initial meeting with all stakeholders in the project to:
- Analyse the existing Management Information (MI) architecture of the business:


- Review accounting processes and systems and ensure that accurate monthly accounts are being efficiently prepared using compliant accounting principles.
- Create a connection with the accounting system of the business to regularly populate the FDPack database with all the historical accounting transactions.
- Build an integrated 3-Way transactional forecasting model for the business that generates forecast and budget transactions in the same format as the historical data already in FDPack. The model can be used to create monthly forecasts, budgets and multi-year strategic planning.
- Analyse the updated statements using the comparative and timeline views defined within FDPack and summarise the significant variances and changes that require management’s attention.
- Provide an objective summary of the financials, the issues they raise and connect them to the wider strategy of the business.
- Present to board, senior management or stakeholder meetings as required and make the statements available each month to all authorised users inside and outside the business using the FDPack interface.

- Maintain rolling monthly updates by switching the current month forecast for the actual, reviewing the forecast assumptions and making any structural changes as the business develops.
- Liaise with external accountants and auditors to harmonise accounting standards, coordinate specialist advice and minimise year-end adjustments and audit fees.
“The FDPack modelling technique is like renovating a classic car. At one point the parts are all over the garage floor but, by the time you have cleaned them up and put them back together again, you have an intimate knowledge of how the car works. Like any classic car it also needs continual attention to keep it running smoothly”
Simon Phippen, FDPack Consultant.
Blogs
Useful content for you designed to simplify and demystify a range of financial subjects
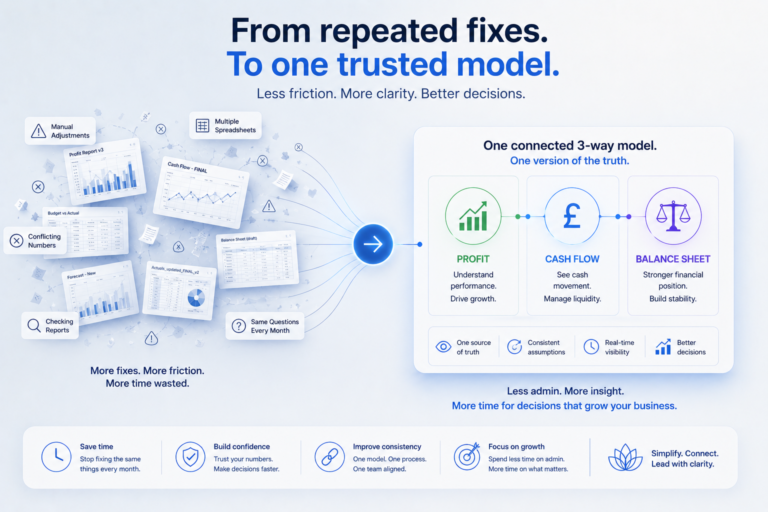
How Many Hours a Week Are You Wasting on “Fixing” Financial Admin?
Most business owners know what they pay for accounting. Few know what they pay for fixing accounting. Not the fee. The effort. The same questions being answered over and over again. None of these appear as a cost in the accounts. But they still consume time. And for many growing businesses, that time becomes a…
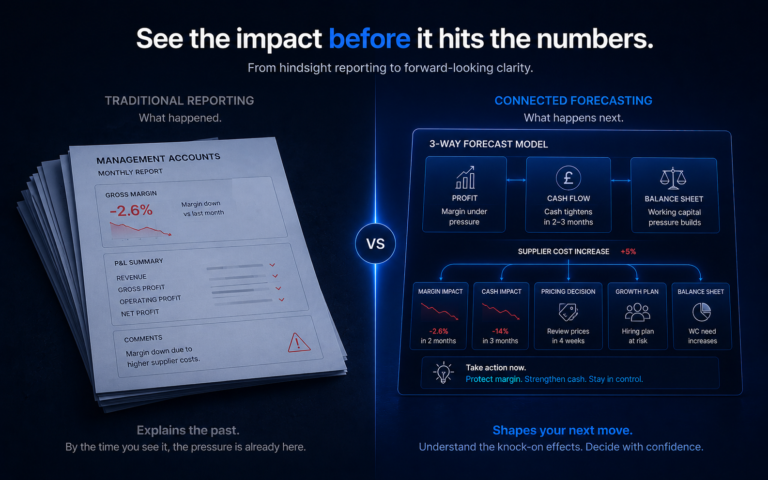
Why Rising Supplier Costs Often Cause Bigger Problems Than Businesses Expect
Most business owners expect rising supplier costs to reduce margins. What they often miss is everything that happens next. The issue is rarely the cost increase itself. The issue is understanding how that increase moves through the business before it appears in the monthly accounts. By the time the impact shows up clearly in the…
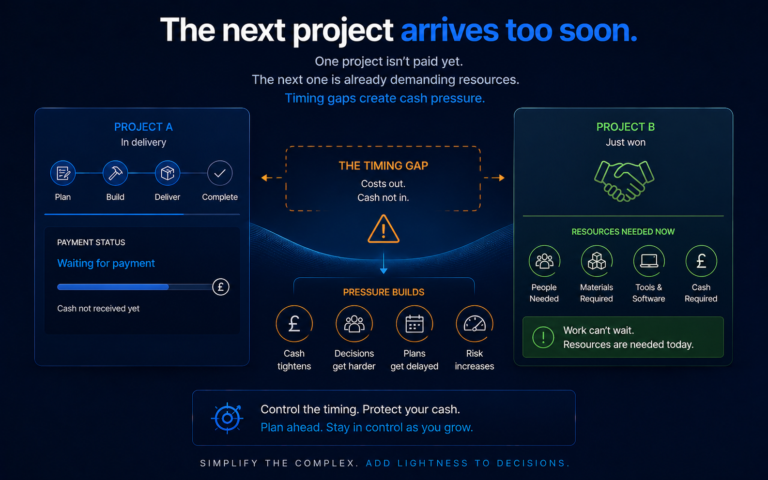
How Can Project-Based Businesses Grow Without Losing Control Of Cash?
Growth creates a unique challenge for project-based businesses. The next project often arrives before the previous one has been paid for. That sounds manageable when projects are small. As projects become larger, the gap becomes more important. The challenge is not winning the next project. The challenge is understanding what those projects require before commitments…
Sign up to receive useful content directly into your inbox
Actionable tips, financial insight and expert advice all in one place
We will never share your details with third parties! Read our privacy policy.